In a previous post we discussed the basics of the approach we are taking to developing an information model of at-risk communities. This really just means a structured approach to organizing all the information we have about the situation we are monitoring.
Our goal is to being able to organize everything we know about a particular situation so that:
1. It is easier for us to characterize the risk of genocide based on what we know
2. We can rapidly update our risk assessments with a continuous stream of new data and events that our monitoring teams collect over time
3. We can easily communicate the big picture perspective to others – organizations that can take action on our early warnings, the media and the public at large
Our plan is to combine the use of existing visualization and business intelligence tools with a relatively simple tag-based visualization timeline that will help us accomplish all of the above.
The basic idea is to code and classify all information that we collect with meta-data tags. The set of tags taken as a whole are the dimensions along which we perceive the situation of concern that we are monitoring.
The core set of tags will be based on the operational processes that we look for – an initial approach we are taking based on the 8 Stages of Genocide model. We will thus classify each new data item as being of interest because of its relevancy to one or more of the operational processes.
The core set of tags will be augmented by new tags that will be created on the fly by analysts that are specific to the situation of concern. For example, names of key political figures, organizations or geographical regions that emerge from the situation. It will be possible to sort and resort everything we know by their tags to explore relationships that might not be obvious initially.
Once we have this set of data and associated meta-data we can use existing BI analysis tools to slice and dice the data as we need. For example, the Tableau platform.
At the same time however we also want a very simple and effective way to present what we know to anyone who is interested. To accomplish that, we are also going to generate an timeline of the events we track in our system available over the web.
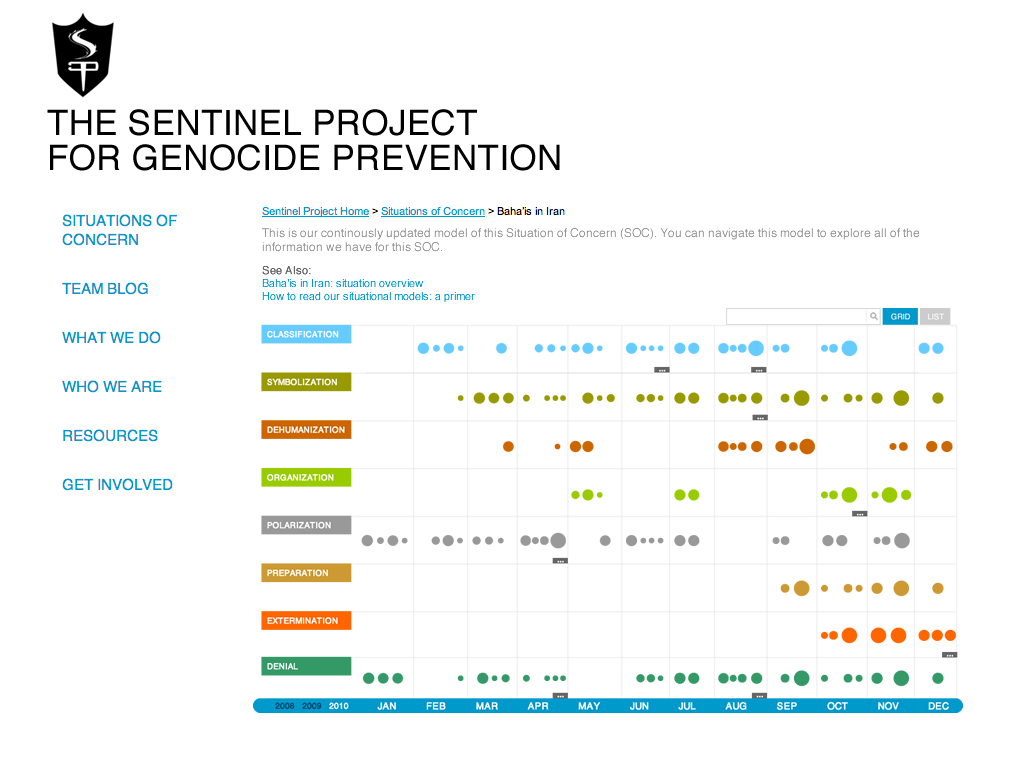
Below is a mockup example of this might look like:

The categories on the left-hand side are just treated as tags within the system, which means that any other set of tags can be used to order the information we have. It is expected that there will be a default perspective but that there will be value in shuffling the view based on tags that are specific to the situation.
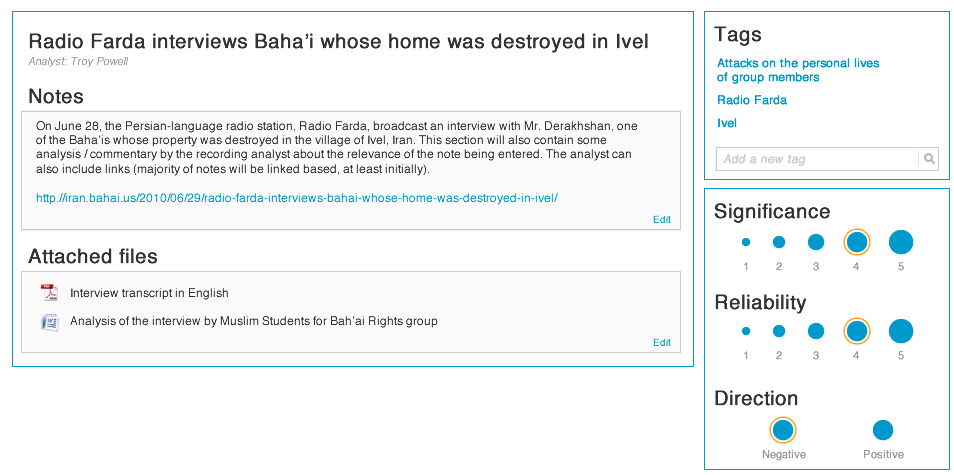
And this is a mockup concept of what an individual data point might look like (i.e. what happens when one of the circles from above is clicked):

The mockup is using an example of a typical datapoint one would find with the Baha’i situation in Iran. The use of situation specific tags is demonstrated in the upper right-hand corner. Some ideas about additionally classifying the nature of the data point is explore on the lower right-hand corner.
The mockups given here are some initial non-functional ideas that we are tinkering with – far from complete or finalized. The idea is that the basic representation of the model will be the grid timeline where each new data point that we add will be represented as a blob of varying size, sorted by some key tags. Clicking on each tag opens up the associated details and analysis.
Its a simple approach and heavier analysis will be left to the professional BI tools that we work with. But the timeline is a simple intuitive way to access all the information we have that we hope will prove to be engaging. It should take only moments for anyone looking at the grid for the first time to quickly understand our representation and start exploring the model and ultimately, our goal is to allow anyone in the world to start contributing to these models. That is where we see the real potential of this approach. Anyone can help flag potential genocides and prevent them from happening.
We are eager to build an initial working version and share that with others so that we start improving the process iteratively after that. Stay tuned for when we release an initial version of the system!
If you have any feedback please contact us. Or you can visit us on Facebook.
Taneem Talukdar
Engineering Team
